Current market study forecasts annual growth of 17 % for bio-based polymers between 2023 and 2028. Demand from Asia and the USA in particular is driving growth, Europe is lagging behind.

- Bild-Infos
- Download
- 7 weitere Medieninhalte
2 Dokumente
- 24-03-07_PR_Short_bi~rt_data_2023_EN.pdf
PDF - 151 kB - 24-03-07_PR_biopolym~rt_data_2023_EN.pdf
PDF - 174 kB
Current market study forecasts annual growth of 17 % for bio-based polymers between 2023 and 2028. Demand from Asia and the USA in particular is driving growth, Europe is lagging behind.
New report released on the global bio‑based polymer market 2023 – a deep and comprehensive insight into a dynamically growing market
The year 2023 was a promising year for bio‑based polymers: PLA capacities have been increased by almost 50 %, and at the same time polyamide capacities are steadily increasing, as well as epoxy resin production. Capacities for 100 % bio-based PE have been expanded and PE and PP made from bio‑based naphtha are being further established with growing volumes. Current and future expansions for PHAs are still on the horizon. After hinting at a comeback in 2022 bio-based PET production dropped in 2023 by 50 %.
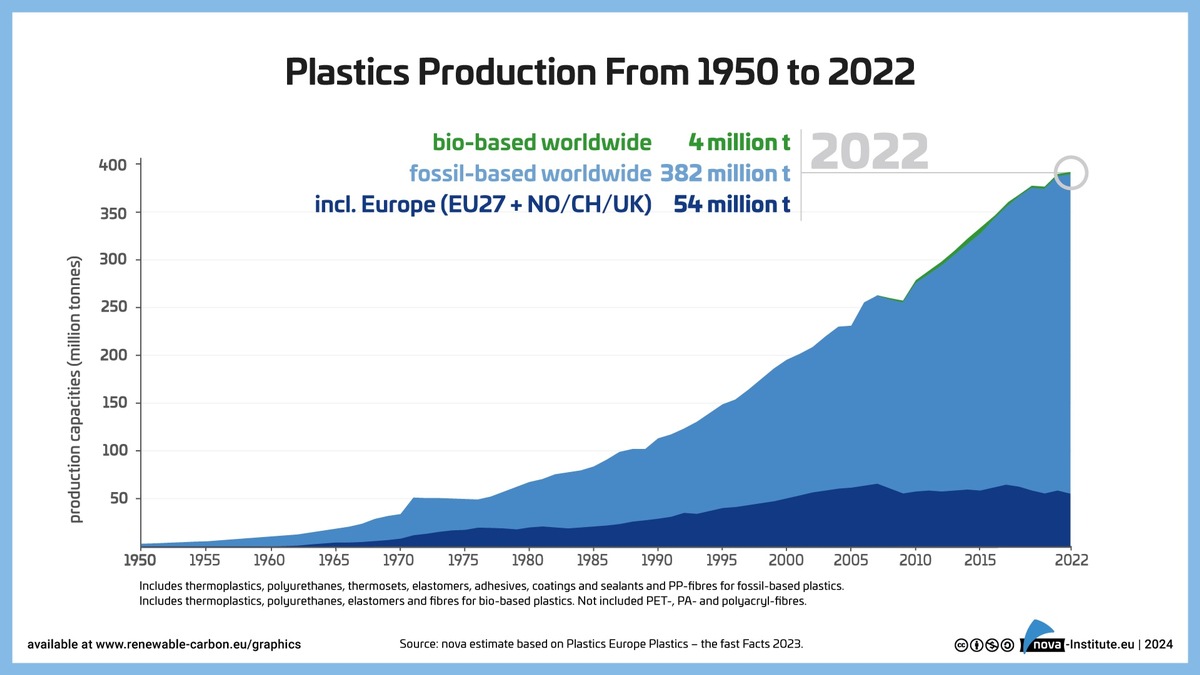
In 2023, the total production volume of bio‑based polymers was 4.4 million tonnes, which is 1 % of the total production volume of fossil‑based polymers. The CAGR of bio-based polymers is, with 17 %, significantly higher than the overall growth of the polymer market (2–3 %) – this is expected to continue until 2028 (Figure 1).
The new market and trend report “Bio‑based Building Blocks and Polymers – Global Capacities, Production and Trends 2023–2028”, written by international biopolymer expert group of the nova-Institute, shows capacities and contains production data for 17 commercially available, bio‑based polymers in the year 2023 and a forecast for 2028. The report is now available in full length as well as a freely available short version here: https://renewable-carbon.eu/commercial-reports.
From the total 4.4 million tonnes of bio-based polymers produced in 2023, cellulose acetate (CA), with a bio-based content of 50 % and epoxy resins with a bio-based content of 45 % made up over the half of the bio-based production, 24 % and 30 %. Followed by 100 % bio-based polylactic acid (PLA) with 11 %, polyamides (PA) (60 % bio-based content) with 8 % and 30 % bio-based polyurethanes (PUR) with 7 %. Polyethylene (PE) (available with 100 and 30 % bio-based content) and polytrimethylene terephthalate (PTT) (31 % bio-based content) had a share of 6 and 5 % (Figure 2). The share of polybutylene adipate-co-terephthalate) (PBAT), polyethylene terephthalate (PET), polyhydroxyalkanoates (PHA) and starch-containing polymer compounds (SCPC) was below 5 %. Aliphatic polycarbonates (APC; linear and circular), casein polymers (CP), ethylene propylene diene monomer rubber (EPDM), polybutylene succinate (PBS), polyethylene furanoate (PEF) and polypropylene (PP) had a share below 1 % of the total bio-based polymer production volume and are not depicted.
Several global brands are already expanding their feedstock portfolio to include sources of renewable carbon, CO2, recycling and, in particular biomass, in addition to fossil-based sources, thereby increasing the demand for bio‑based and biodegradable polymers. At the same time, however, there is a lack of political support in Europe, which still only promotes biofuels and bioenergy. By contrast, supportive legislation is in place in Asia and particularly in the US drives demand.
For 2023, the updated market report includes the following features on 438 pages: Coverage of 16 bio-based building blocks and all 17 commercially available bio-based polymers, comprehensive information on the capacity development from 2018 to 2028, production data for the year 2022 and 2023, per bio-based polymer and analyses of market developments and producers per building block and polymer, so that readers can quickly gain an overview of developments that go far beyond capacity and production figures. Additionally, the market study offers a statistical overview on “Mass Balance and Free Attribution (MBFA)” products available worldwide based on an extensive analysis of the ISCC database, a detailed elaboration on the current European policy for bio-based polymers as well as a comprehensive summary on biodegradability and biodegradable polymers. This information is supported by over 70 figures, over 50 tables and 232 company profiles.
The data published annually by European Bioplastics and the data published by Plastics Europe for 2022 are taken from the market report published by the nova-Institute, albeit with a smaller selection of bio-based polymers and application areas in each case.
Capacity Increase
The increase in production capacity from 2022 to 2023 is mainly based on the expansion of PLA and polyamide capacities and epoxy resin production in Asia, as well as an increase in polyethylene (PE) production capacity in South America. Also, worldwide expansions for polyhydroxyalkanoates (PHAs) were reported in 2023. Especially PHAs, PLA, polyamides and PE and PP will continue to grow significantly (35 % on average) by 2028. While capacities for PHA and PLA will grow worldwide with 57 and 37 %, PA will mainly increase in Asia by 29 % and PE in Asia, Europe and North America and PP in North America with 38 % (combined).
Bio-based Feedstock and Land Use
Considering the steadily increasing demand for bio‑based polymers, the need for biomass feedstocks should be taken into account as an important factor. This is especially true for the recurring debate on the use of food crops for bio‑based polymer production. Figure 3 shows the worldwide biomass utilisation in 2023. The total demand for biomass was 13.5 billion tonnes for feed, bioenergy, food, material use, biofuels as well as bio‑based polymers. While the majority of the biomass (56 %) is used for feed production, only 0.029 % are needed for bio‑based polymer production. That results in a biomass feedstock demand of 3.9 million tonnes for the production of 4.4 million tonnes of bio‑based polymers. The major feedstock used for bio‑based polymer production were sugars (28 %) and starch was used with 24 %. These feedstocks are gained from high-yielding crops as sugarcane and maize resulting in high area efficiency.
Additionally, these yields are not only used for polymer production, but also for animal feed, regarding the protein share, and thus only a part is allocated. Glycerol (25 %) a biogenic process by‑product from biodiesel production represents a biomass with only an indirect, passive land use. This glycerol is mainly used for epoxy resin production via epichlorohydrin as an intermediate. The utilised biomass also comprised 12 % non‑edible plant oil, such as castor oil, 7 % from cellulose (mainly used for CA) and 4 % from edible plant oil. From the 4.4 million tonnes of produced bio‑based polymers (fully and partly bio‑based) 2.5 million tonnes were actual bio‑based components of the polymers (57 %). Considering this fact, almost 1.6 times more feedstock was needed than actually is incorporated into the final product. The 1.4 million tonnes (36 %) of feedstock that was not used in the product is due to a high number of conversion steps and related feedstock and intermediate losses, as well as the formation of by‑products.
Drivers and Policy
The most important market drivers in 2023 were several global brands that adapted their strategic agenda to transition the polymers, plastics and chemicals industry to become sustainable, climate‑friendly and part of the circular economy, thus offering their customers environmentally friendly solutions and critical consumers alternatives to petrochemical products. The only way for this successful transition is the complete substitution of fossil carbon with renewable carbon from alternative sources: biomass, CO2 and recycling (www.renewable-carbon.eu). By expanding their feedstock portfolio to include, next to fossil‑based, renewable carbon, these brands strike the rethinking from the market point of view. Especially in the use of biomass, this rethinking increased and will further increase the supply of bio‑based as well as biodegradable polymers. Nevertheless, the market remains challenging in terms of crude oil prices and from a political perspective, as major advantages of bio‑based polymers have not been politically rewarded yet: 1) Bio-based polymers replace fossil carbon in the production process with renewable carbon from biomass. This is indispensable for a sustainable, climate-friendly plastics industry and, 2) Biodegradability is offered by almost the half of the produced bio-based polymers. This should only be a solution for plastics that cannot be collected and enter the environment. In these situations, they can biodegrade without leaving behind microplastics. Only two countries, Italy and Austria will politically support this additional disposal path.
If bio‑based polymers were to be accepted as a solution and promoted in a similar way as biofuels, annual growth rates of 20 % and more could be expected. The same would apply, should the oil price rise significantly. Based on the already existing technical maturity of bio‑based polymers, considerable market shares could be gained in these cases.
End of the short version, long version of the press release continues below.
Bio-based Polymers – The Highlights
The global polymer market includes functional and structural polymers, rubber products as well as man‑made fibres (Figure 4). This report focuses on the bio‑based share of the structural polymers. Bio‑based structural polymers are composed of the polymers that will later form the structural mass of the finished plastic part, exhaustively reviewed in this report and the bio‑based linoleum part, and amounting together to 4.5 million tonnes. On the other hand, the total amount of bio‑based functional polymers consists of bio‑based functional polymers and paper starch, yielding 13.7 million tonnes. Besides these two groups with up to 18.2 million tonnes of bio‑based functional and structural polymers, also rubber products and man‑made fibres can be bio‑based. In total, 14 million tonnes of rubber products and 7.2 million tonnes of man‑made fibres are from bio‑based resources, 50 % and 8 %.
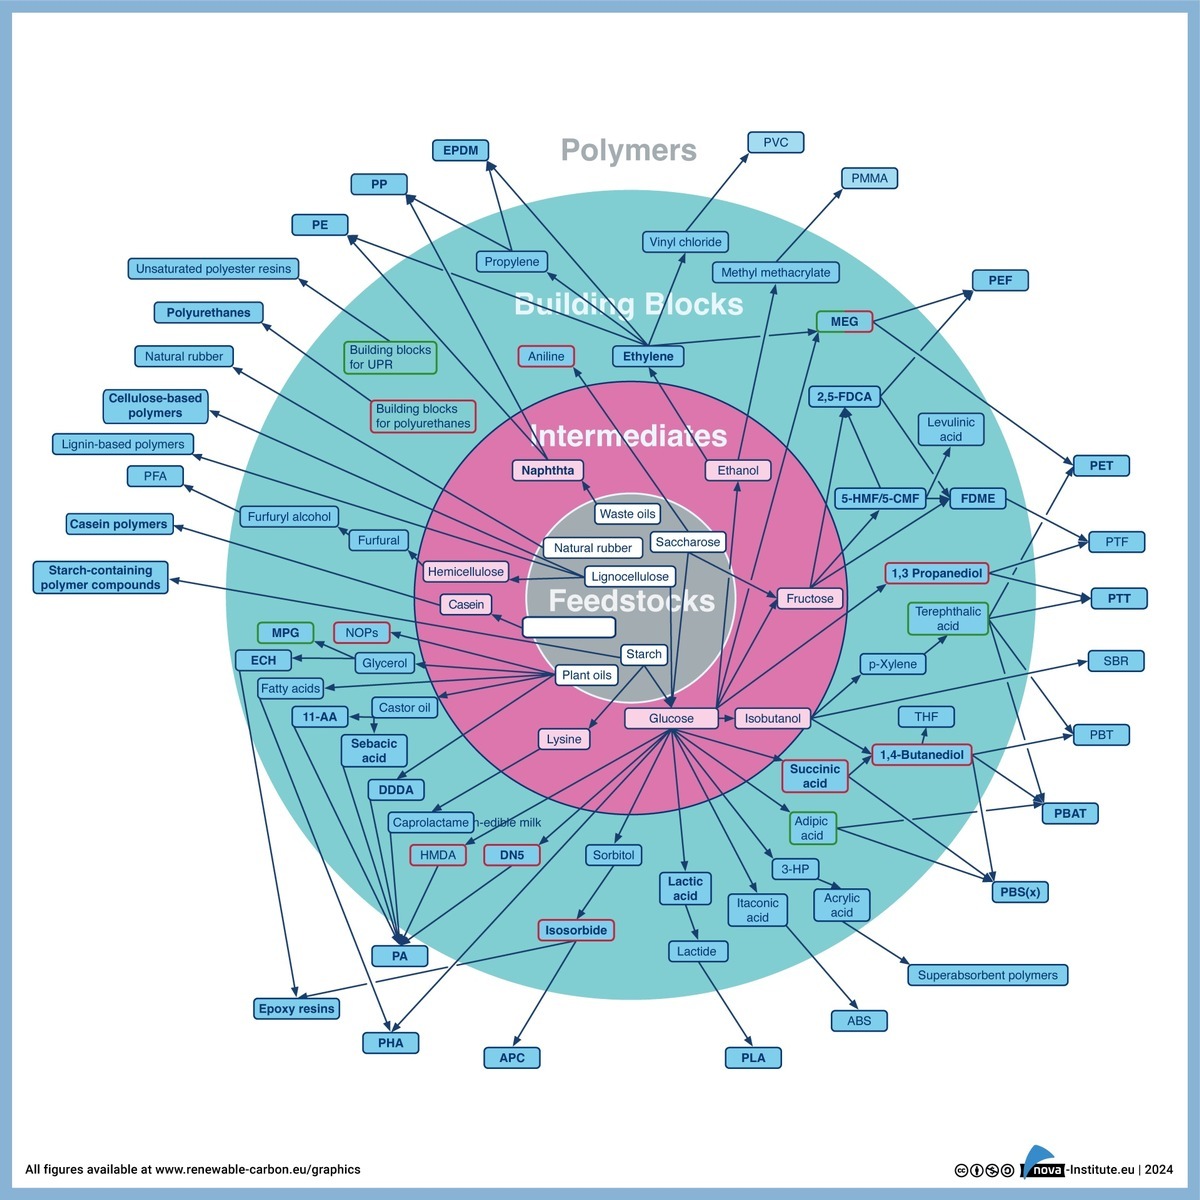
Figure 5 shows all (semi‑)commercial pathways from biomass via different intermediates and building blocks to bio‑based polymers. Bio‑based building blocks and polymers analysed in detail within the report are highlighted in bold.
Figure 6 shows the different pathways of bio‑based “drop‑in”, “smart drop‑in” and “dedicated” inputs within the chemical production chain. For each group, certain bio‑based polymers are exemplarily shown. Additionally, biodegradable bio‑based polymers are highlighted with a green dot. The different bio‑based polymer groups are subject to different market dynamics. While drop‑ins have direct fossil‑based counterparts and can substitute them, the dedicated ones have new properties and functionalities that petrochemistry does not provide. Both have their own advantages and disadvantages from a production and market perspective.
While bio‑based drop‑in chemicals are bio‑based versions of existing petrochemicals, which have established markets and are chemically identical to existing fossil‑based chemicals, smart drop‑in chemicals are a special sub‑group of drop‑in chemicals. Even though they are chemically identical to existing chemicals based on fossil hydrocarbons, their bio‑based pathways provide significant process advantages compared to the conventional pathways. Additionally, these bio‑based pathways can be built on completely new approaches, such as epichlorohydrin, where the fossil feedstock propylene is not substituted by bio‑based propylene but with glycerol from biodiesel production. Dedicated bio‑based chemicals are chemicals which are produced commercially via a dedicated pathway and do not have an identical fossil‑based counterpart.
Figure 7 summarises the results of the report and the development of capacities from 2018 to 2028 on the basis of forecasts by current and some new producers. The total installed capacity in 2023 was 4.8 million tonnes with an actual production of 4.4 million tonnes. An increase to 10.5 million tonnes capacity in 2028 is expected, indicating an average compound annual growth rate (CAGR) of about 17 %. The following polymers show an even higher increase significantly above the average growth rate: PHA will grow 57 %, PLA by 37 %, PA will continue to grow by 29 % and PE and PP by 28 % (combined) until 2028.
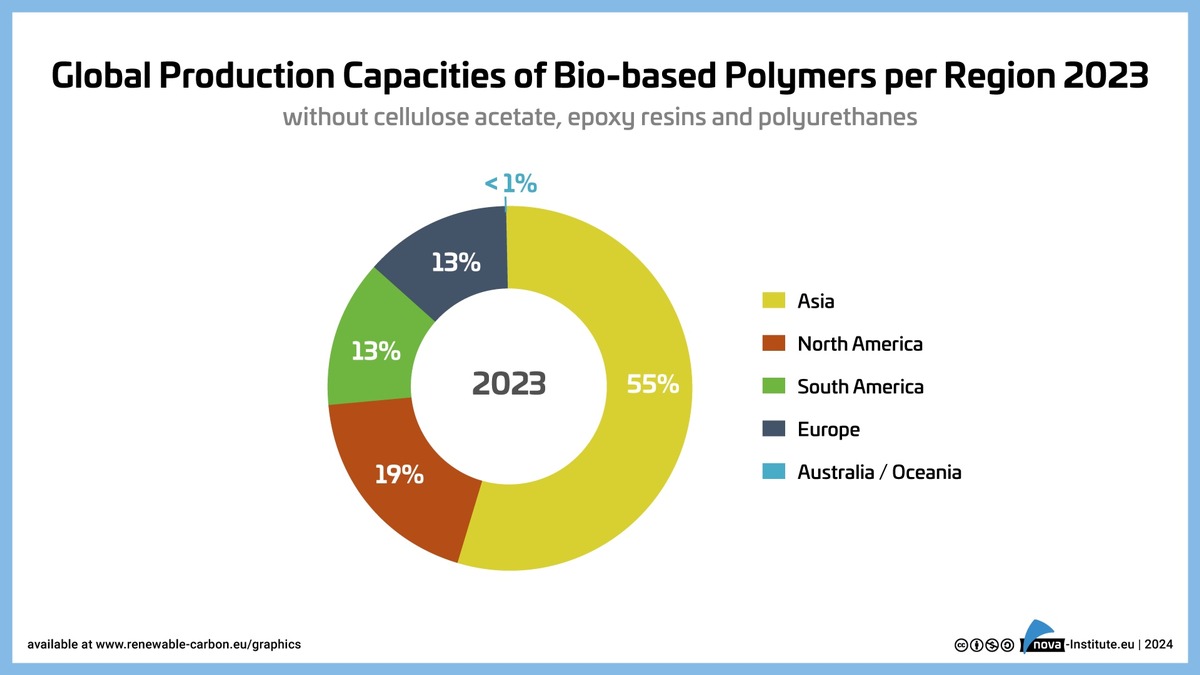
Global Production Capacities of Bio-based Polymers by Region
Asia, the leading continent in 2023, has the largest installed bio‑based production capacities in the world with 55 %, with the largest capacities for PLA and PA. North America has 19 % with large installed capacities for PLA and PTT, and South America has 13 %, mainly based on PE. In contrast to 2022, European shares in worldwide bio-based polymer capacities has decreased to 13 %. This is mainly based on the updated data for PE and PP being produced in Europe, where only 10 % of the total volume is known to be bio-based and 90 % are bio-attributed based on mass balance and free attribution (MBFA). The European share is mainly based on installed capacities for SCPC and PA. Less than 1 % share of Australia / Oceania was based on SCPC (Figure 8). With an expected CAGR of 35 % between 2023 and 2028, Asia displays by far the highest growth of bio‑based polymer capacities compared to other regions in the world. This increase is mainly due to extended production capacities for PA, PHA and PLA.
Market Segments for Bio-based Polymers
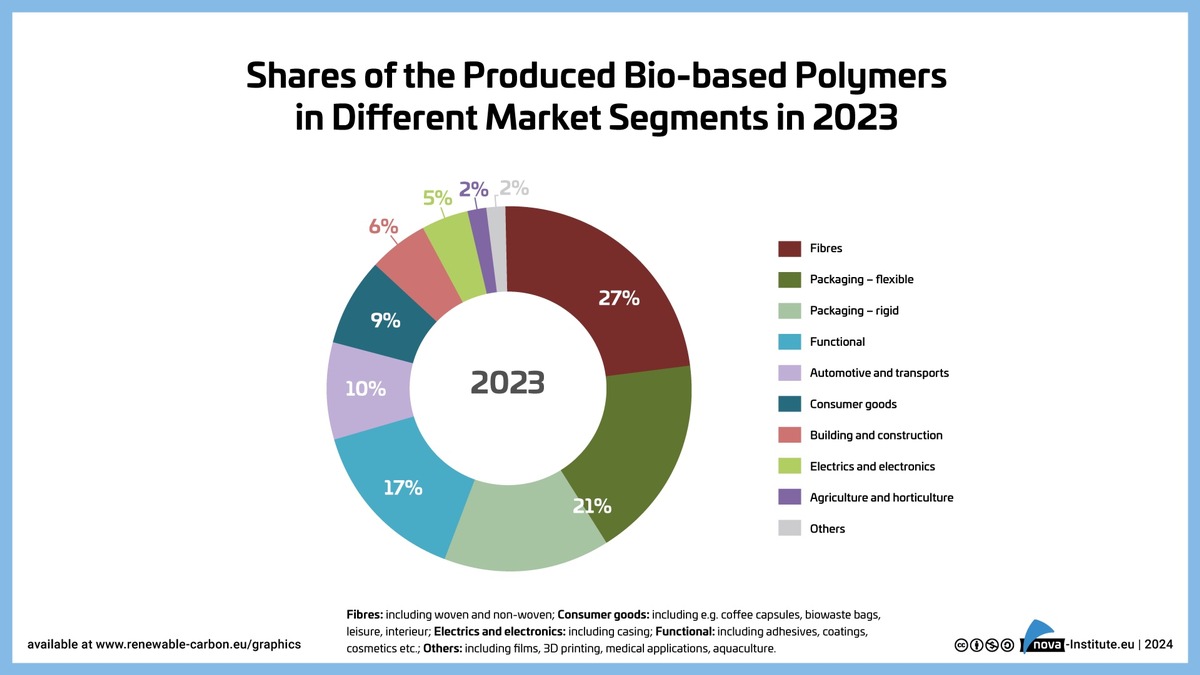
Today, bio‑based polymers can be used in almost all market segments and applications, but the various applications per polymer can be very different. Figure 9 shows a summary of the applications for all bio‑based polymers covered in the report. In 2023 fibres including woven, non‑woven (mainly CA and PTT) had the highest share with 27 %. Packaging, flexible and rigid, had a 21 % share in total, followed by functional applications with 17 % (mainly epoxy resins and PUR), automotive and transport with 10 % (mainly PA, epoxy resins and PUR) and consumer goods with 9 % (mainly PA, epoxy resins and PLA). Building and construction had a 6 % share (mainly epoxy resins and PUR) and electrics and electronics 5 % (mainly epoxy resins and PA). The market segments agri‑ and horticulture and others had a market share of 2 %, respectively.
Bio-based and Non-biodegradable Polymers and Biodegradable Polymers
Bio-based non-biodegradable polymers show a CAGR of 13 % until 2028 (Figure 10). Here, the highest growth is expected for PA with 29 %, followed by PE and PP with 28 % (combined). Bio-based biodegradable polymers show an even higher growth, with 22 %, compared to the overall bio-based polymer growth of 17 % until 2028 (Figure 11). This is mainly based on high growth rates for PHA with 57 % and PLA with 37 %. Biodegradability of polymers is completely independent from the resource the polymer is made of, thus being bio-based does not necessarily implement biodegradability of certain polymers. PBS and copolymers such as polybutylene succinate-co-butylene adipate (PBSA) are both industrial compostable, but only PBSA biodegrades also under home composting conditions and in soil, according to the conditions defined in the established standards and certification schemes. The same is true for PBAT, it is industrial compostable and, for certain grades, also home compostable as well as biodegradable in soil. This biodegradability applies for bio-based as well as fossil-based PBS and PBAT. As this report focuses on bio-based polymers, development of fossil-based PBS and PBAT, though being biodegradable, is not detailly shown here. But fossil-based PBS and PBAT production capacities, mainly in Asia, were at 1.4 million tonnes in 2023, with an assumed actual production of about 500,000 tonnes. Until 2028 fossil-based PBS and PBAT production capacities are expected to increase with a CAGR of 15 %.
Please find the full and short version of the report here: https://renewable-carbon.eu/commercial-reports.
Responsible for the content under German press law (V. i. S. d. P.):
Dipl.-Phys. Michael Carus (Managing Director)
nova-Institut GmbH, Leyboldstr. 16, DE-50354 Hürth (Germany)
Email:  contact@nova-institut.de
Phone: +49 (0) 22 33-460 14 00
nova-Institut GmbH has been working in the field of sustainability since the mid-1990s and focuses today primarily on the topic of renewable carbon cycles (recycling, bioeconomy and CO2 utilization/CCU).
As an independent research institute, nova supports in particular customers in chemical, plastics and materials industries with the transformation from fossil to renewable carbon from biomass, direct CO2 utilization and recycling.
Both in the accompanying research of international innovation projects and in individual, scientifically based management consulting, a multidisciplinary team of scientists at nova deals with the entire range of topics from renewable raw materials, technologies and markets, economics, political framework conditions, life cycle assessments and sustainability to communication, target groups and strategy development.
50 experts from various disciplines are working together on the defossilization of the industry and for a climate neutral future. More information at: nova-institute.eu – renewable-carbon.eu
Subscribe to our newsletters at http://www.renewable-carbon.eu/newsletters


.jpeg.jpg)