Gaining momentum – Bio-based polymers grow at a CAGR of 14% between 2022 and 2027
- Bild-Infos
- Download
- 8 weitere Medieninhalte
2 Dokumente
- 23-02-09_PR_long_ver~eport_data_2022.pdf
PDF - 179 kB - 23-02-09_PR_short_ve~eport_data_2022.pdf
PDF - 160 kB
Gaining momentum – Bio-based polymers grow at a CAGR of 14% between 2022 and 2027
Report on the global bio-based polymer market 2022 – A deep and comprehensive insight into this dynamically growing market
The year 2022 was a promising year for bio-based polymers: Bio-based epoxy resin production is on the rise, PTT regained attractiveness after several years of constant capacities and PE and PP made from bio-based naphtha are being further established with growing volumes. Increased capacities for PLA are ongoing, after being sold out in 2019. Current and future expansions for bio-based polyamides as well as PHAs are on the horizon. And also, bio-based PET is getting back in the game.
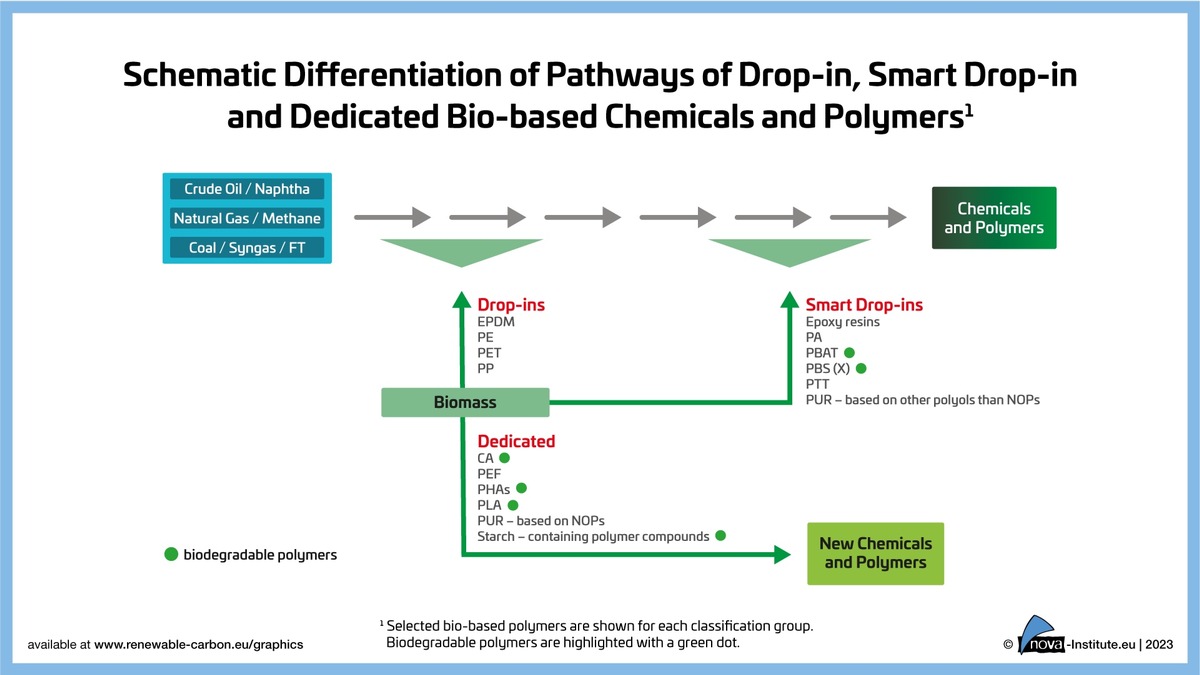
The new market and trend report “Bio-based Building Blocks and Polymers – Global Capacities, Production and Trends 2022–2027” by the international nova biopolymer expert group shows capacities and production data for 17 commercially available, bio based polymers in the year 2022 and a forecast to 2027. These polymers can be grouped in bio-based “drop-in”, “smart drop-in” and “dedicated” inputs within the chemical production chain. For each group, certain bio-based polymers are exemplarily shown (Figure 6). Additionally, biodegradable bio-based polymers are highlighted with a green dot. The different bio-based polymer groups are subject to different market dynamics.
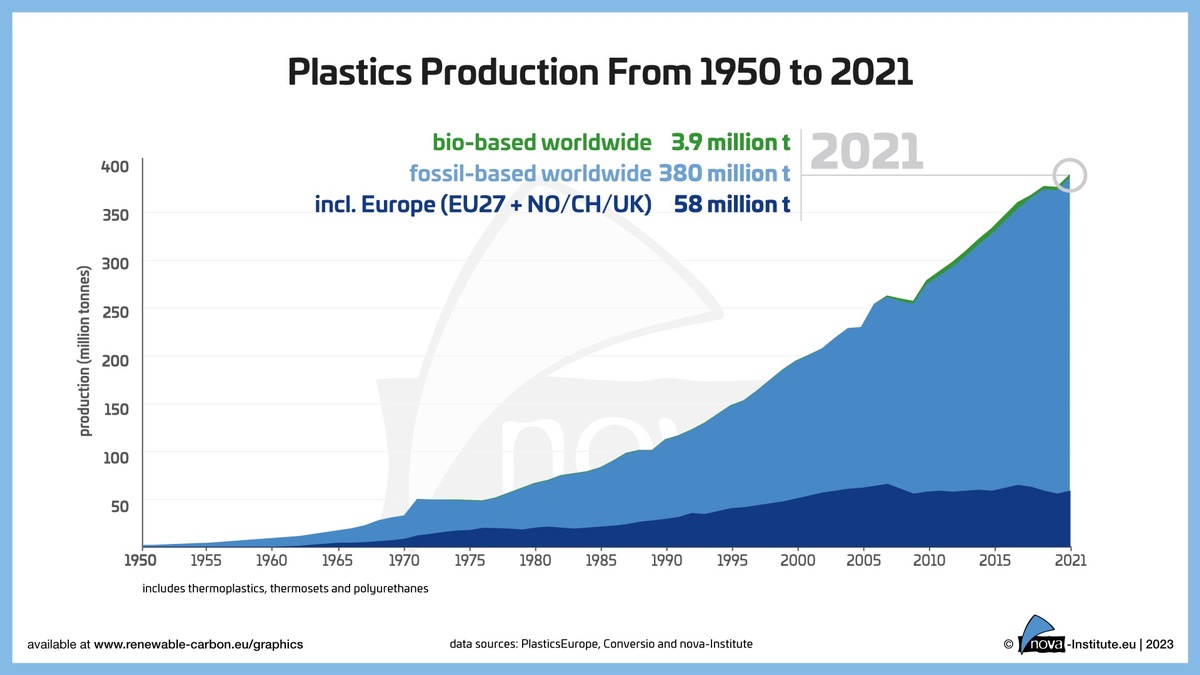
In 2022, the total installed capacity in 2022 was 4.9 million tonnes with an actual production of 4.5 million tonnes, which is 1% of the total production volume of fossil based polymers. An increase to 9.3 million tonnes capacity in 2027 is expected, indicating an average compound annual growth rate (CAGR) of about 14%, significantly higher than the overall growth of polymers (3–4%). The following polymers show an even higher increase significantly above the average growth rate: PHA will grow by 45%, PLA by 39%, PA will continue to grow by 37% and PP by 34% until 2027. PE in Europe will increase by 18% until 2027, followed by a 15% increase in casein polymers (Figure 7).
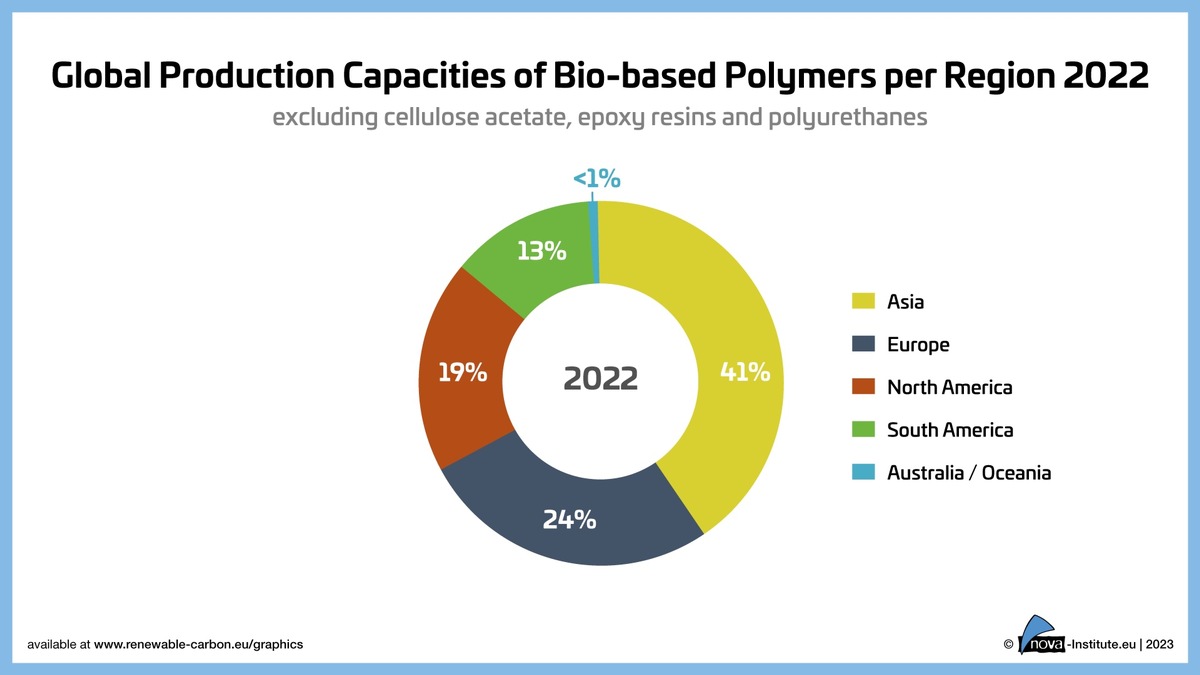
After Asia as leading region, which has installed the largest bio based production capacities worldwide with 41% in 2022, the largest capacities being for PLA and PA, Europe follows with 27%, mainly based on starch-containing polymer compounds, PE and PP. North America shares 19% with major installed capacities for PLA and PTT and South America 13%, mainly based on PE. The less then 1% share of Australia/Oceania is based on starch-containing polymer compounds (Figure 8). Today, bio based polymers can be used in almost all market segments and applications, but the various applications per polymer can be very different. Figure 9 shows a summary of the applications for all bio based polymers covered in the report.
The major feedstock used for bio-based polymer production are sugars (29%), starch is used with 18%. These feedstocks are gained from high-yielding sugarcane and maize resulting in high area efficiency. Additionally, these yields are not only used for polymer production but also for animal feed, regarding the protein share, and thus only a part is allocated. Glycerol (27%) a by-product from biodiesel production represents a biomass without additional land use.
Several global brands are already expanding their feedstock portfolio to include, next to fossil-based, also sources of renewable carbon, CO2, recycling and especially biomass. This rethinking from the market point of view, especially in the use of biomass, will, and already did, increase the demand and supply of bio-based as well as biodegradable polymers. Today, renewable carbon from biomass, CO2 and recycling is making up 11% of the worldwide polymer market. Nevertheless, at the same time, there is a lack of support from policy in Europe, which still only promotes biofuels and bioenergy. In contrast, supportive regulations for bio-based chemicals and polymers can be found in Asia and especially in the US.
For 2022, the annually updated market report is featuring 16 selected bio-based building blocks and 17 commercially available bio-based polymers, comprehensive information on the capacity development from 2018 to 2027, as well as production data for the year 2021 and 2022 per bio-based polymer. Furthermore, the report includes analyses of market developments and producers per building block and polymer, so that readers can quickly gain an overview of developments that go far beyond capacity and production figures. As an additional bonus, the report provides a comprehensive expert view on “Mass Balance and Free Attribution (MBFA)” as well as on the “Packaging and Packaging Waste Regulation”. Finally, the deep insight into bio-based manufacturers, launched in 2018, has been extensively updated and now features 200 detailed company profiles – from start ups to multinational corporations.
The data published annually by European Bioplastics ( www.european-bioplastics.org/market) are derived from this market report, but with a smaller selection of bio-based polymers.
The market and trend report was conducted by the international nova biopolymer expert group. The authors are from Europe and North America. The 2022 report is now available for € 3,000 at https://renewable-carbon.eu/commercial-reports.
If you want to meet the authors and discuss the market data personally, then do not miss the nova Session: “Bio- and CO2-based Polymers: Production, Trends 2022-2027 and the latest Policy Developments” on 22 March 2023, hybrid event. Register now and get one of the limited spots events.renewable-carbon.eu/polymer-session.
End of short version.
The increase in production capacity from 2021 to 2022, is mainly based on the expansion of bio-based epoxy resin and polytrimethylene terephthalate (PTT) production in Asia, as well as an increase in polyethylene (PE) and polypropylene (PP) in Europe. Moreover, increased and new Asian production capacities for polylactic acid (PLA) and polyamides (PA), as well as worldwide expansion for polyhydroxyalkanoates (PHAs) were reported in 2022. Especially PHAs, PLA, polyamides and PP will continue to grow significantly (34–45%) by 2027. While capacities for polyhydroxyalkanoates (PHA) and PLA will grow worldwide with 45 and 39%, respectively, polyamides will mainly increase by 37% in Asia and PP with 34% in Europe.
Bio-based feedstock and land use
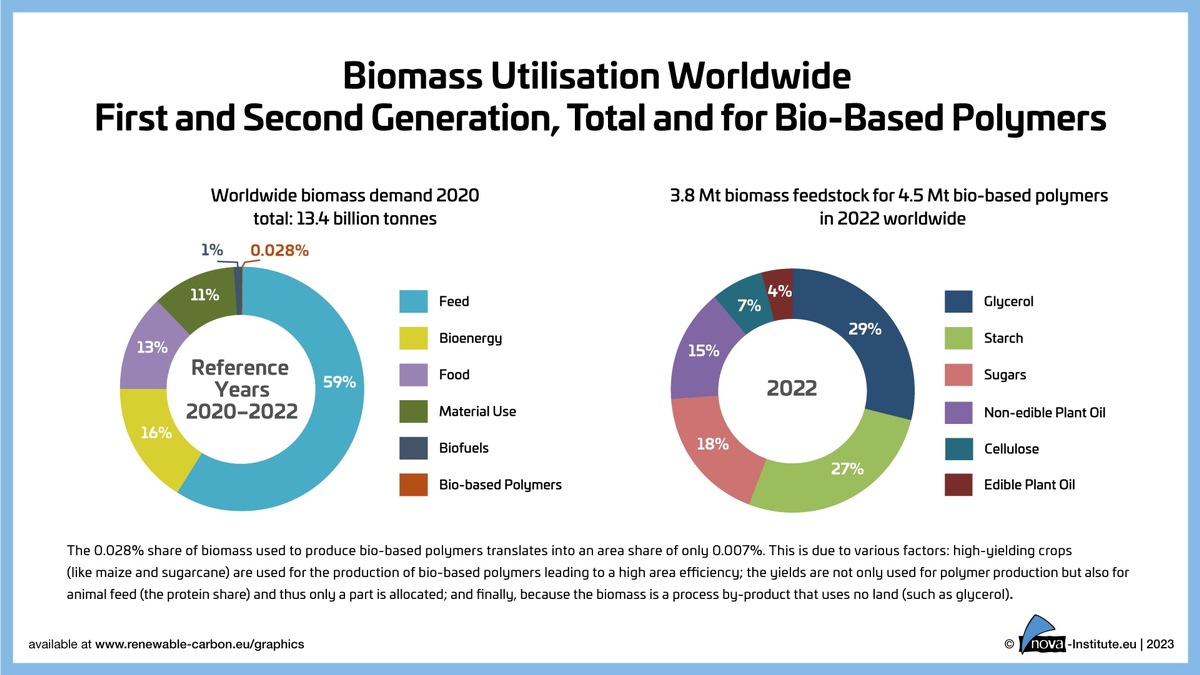
Considering the steadily increasing demand for bio-based polymers, the need for biomass feedstocks should be taken into account as an important factor. This is especially true for the recurring debate on the use of food crops for bio‑based polymer production. Figure 2 shows the worldwide biomass utilisation in 2022. The total demand for biomass was 13.4 billion tonnes for feed, bioenergy, food, material use, biofuels as well as bio‑based polymers. While the majority of the biomass (59%) is used for feed, only 0.028% are needed for bio‑based polymer production. This results in a biomass feedstock demand of 3.8 million tonnes for the production of 4.5 million tonnes of (fully and partly) bio-based polymers and corresponds to an agricultural land share of only 0.007%. This small area share is due to various factors: The major feedstock used for bio-based polymer production are sugars (29%), starch is used with 18%. These feedstocks are gained from high-yielding sugarcane and maize resulting in high area efficiency. Additionally, these yields are not only used for polymer production but also for animal feed, regarding the protein share, and thus only a part is allocated. Glycerol (27%) a by‑product from biodiesel production represents a biomass without additional land use. This glycerol is mainly used for epoxy resin production via epichlorohydrin as an intermediate. The utilised biomass also comprises 15% non‑edible plant oil, such as castor oil, 7% from cellulose (mainly used for cellulose acetate) and 4% from edible plant oil.
From the 4.5 million tonnes of produced (fully and partly) bio-based polymers 2.3 million tonnes are actual bio‑based components of the polymers (50%). Considering this fact, almost 1.7 times more feedstock is needed than actually is incorporated into the final product. This amount of 1.5 million tonnes (40%) of feedstock that is not ending up in the product is due to a high number of conversion steps and related feedstock and intermediate losses, as well as the formation of by-products.
Sustainability and renewable carbon
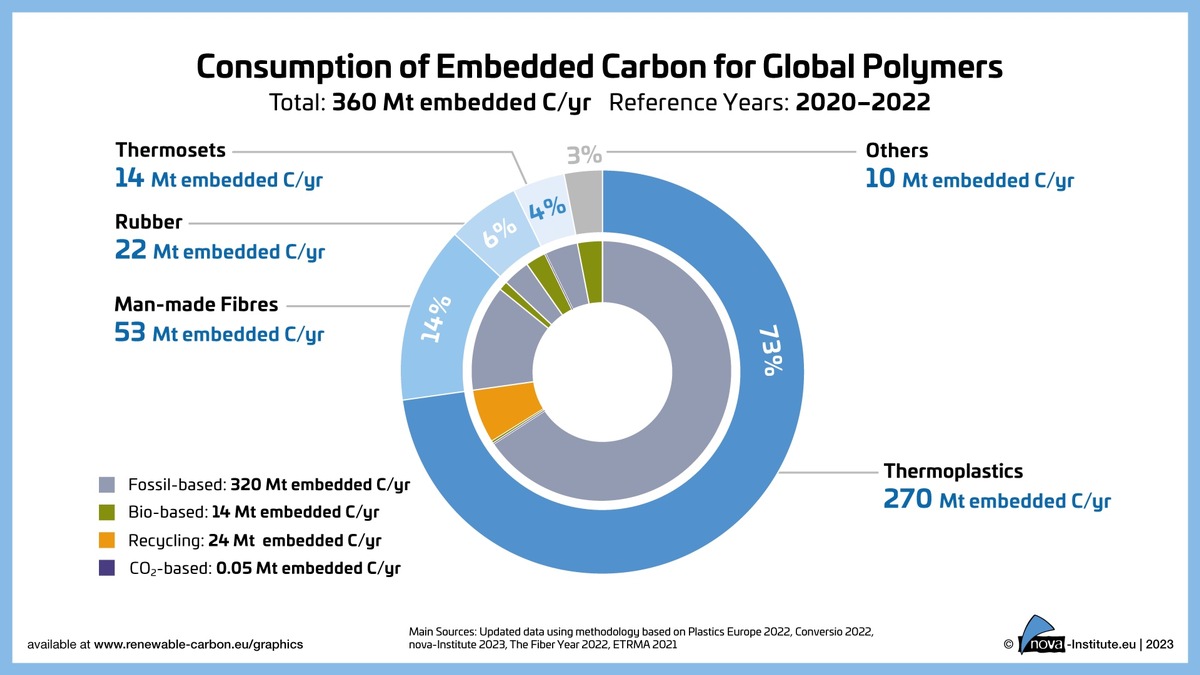
The only way for polymers, plastics and chemicals to become sustainable, climate-friendly and part of the circular economy is the complete substitution of fossil carbon with renewable carbon from alternative sources: biomass, CO2 and recycling ( www.renewable-carbon.eu). This necessary transition is already on the strategic agenda of several global brands, that are already expanding their feedstock portfolio to include, next to fossil-based, all three sources of renewable carbon. This rethinking from the market point of view, especially in the use of biomass, will, and already did, increase the supply of bio-based as well as biodegradable polymers. Today, renewable carbon from biomass, CO2 and recycling is making up 11% of the worldwide polymer market (Figure 3).
Nevertheless, the market remains challenging from a political perspective and in terms of crude oil prices, as major advantages of bio-based polymers have not been politically rewarded yet: Bio-based polymers replace fossil carbon in the production process with renewable carbon from biomass. This is indispensable for a sustainable, climate-friendly plastics industry. Biodegradability is offered by almost half of the produced bio-based polymers. This can be a risk minimisation for plastics that cannot be collected and enter the environment. In these cases, they can be biodegraded without leaving microplastics. Only two European countries, Italy and Austria will politically support this additional disposal path.
The key market drivers in 2022 are brands looking to reduce their company's carbon footprint and offer environmentally friendly solutions to their customers, as well as critical consumers looking for alternatives to petrochemical products. If bio-based polymers were to be accepted as a solution and promoted in a similar way as biofuels, annual growth rates of 20% and more could be expected. The same would apply, should the oil price rise significantly. Based on the already existing technical maturity of bio-based polymers, considerable market shares could be gained in these cases.
Bio-based polymers
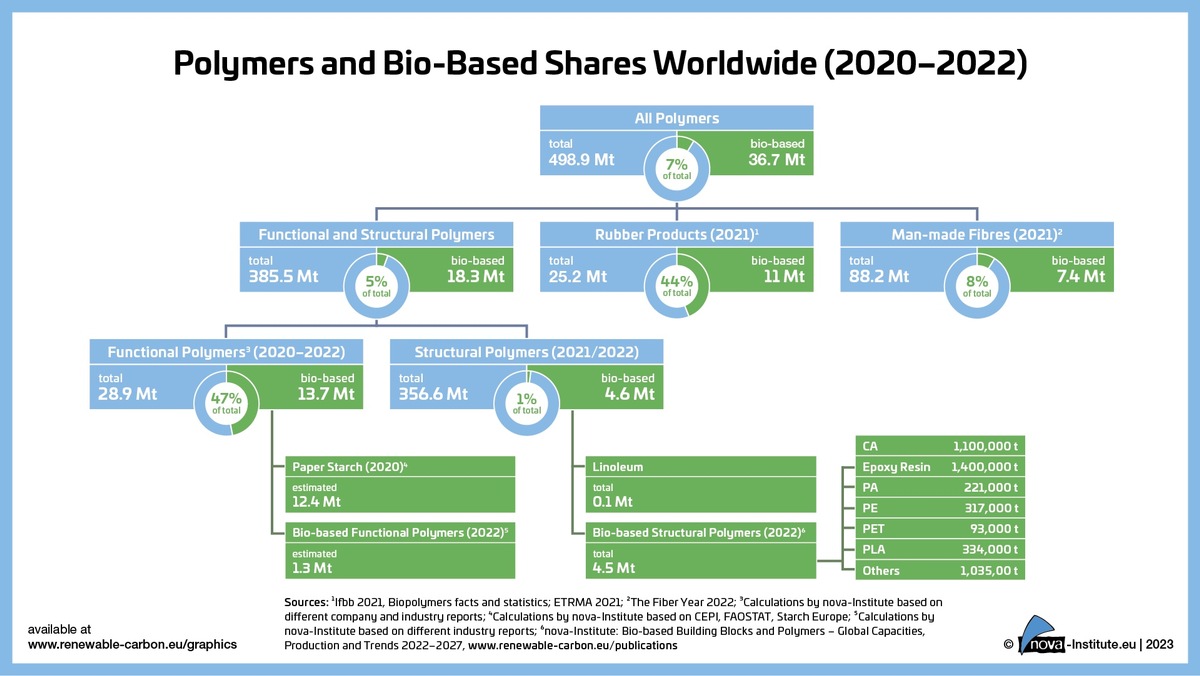
The global polymer market includes functional and structural polymers, rubber products as well as man‑made fibres (Figure 4). This report focuses on the bio-based share of the structural polymers. Bio-based structural polymers are composed of the polymers that will later form the structural mass of the finished plastic part, exhaustively reviewed in this report and the bio‑based linoleum part; together amounting to 4.6 million tonnes. In addition, the total amount of bio-based functional polymers consists of bio-based functional polymers including paper starch, yielding 13.7 million tonnes. Besides these two groups making up 18.3 million tonnes of bio-based functional and structural polymers, also rubber products and man-made fibres can be bio‑based. In total, 11 million tonnes of rubber products and 7.4 million tonnes of man-made fibres are from bio-based resources, 44% and 8% respectively.
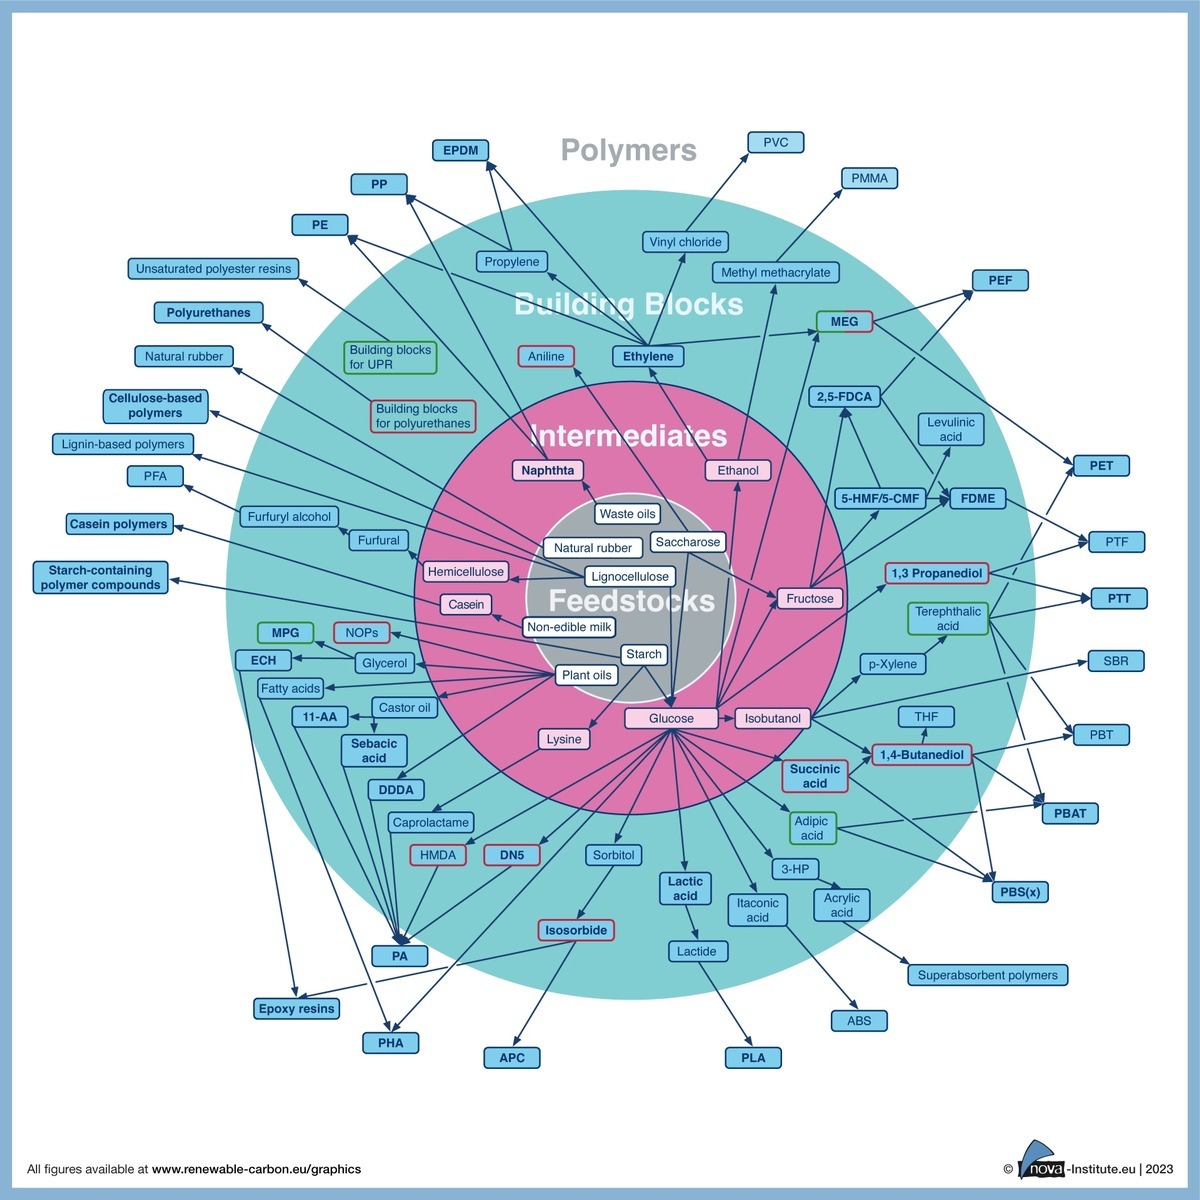
Figure 5 shows all (semi-) commercial pathways from biomass via different intermediates and building blocks to bio-based polymers. Bio-based building blocks and polymers analysed in detail within the report are highlighted in bold.
Figure 6 shows the different pathways of bio-based “drop-in”, “smart drop-in” and “dedicated” inputs within the chemical production chain. For each group, certain bio-based polymers are exemplarily shown. Additionally, biodegradable bio-based polymers are highlighted with a green dot. The different bio-based polymer groups are subject to different market dynamics. While drop-ins have direct fossil-based counterparts and can substitute them, the dedicated ones have new properties and functionalities that petrochemistry does not provide. Both have their own advantages and disadvantages from a production and market perspective. While bio-based drop-in chemicals are bio-based versions of existing petrochemicals, which have established markets and are chemically identical to existing fossil-based chemicals, smart drop-in chemicals are a special sub-group of drop-in chemicals. Even though they are chemically identical to existing chemicals based on fossil hydrocarbons, their bio-based pathways provide significant process advantages compared to the conventional pathways. Additionally, these bio-based pathways can be built on completely new approaches, such as epichlorohydrin, where the fossil feedstock propylene is not substituted by bio-based propylene but with glycerol from biodiesel production. Dedicated bio-based chemicals are chemicals which are produced commercially via a dedicated pathway and do not have an identical fossil-based counterpart.
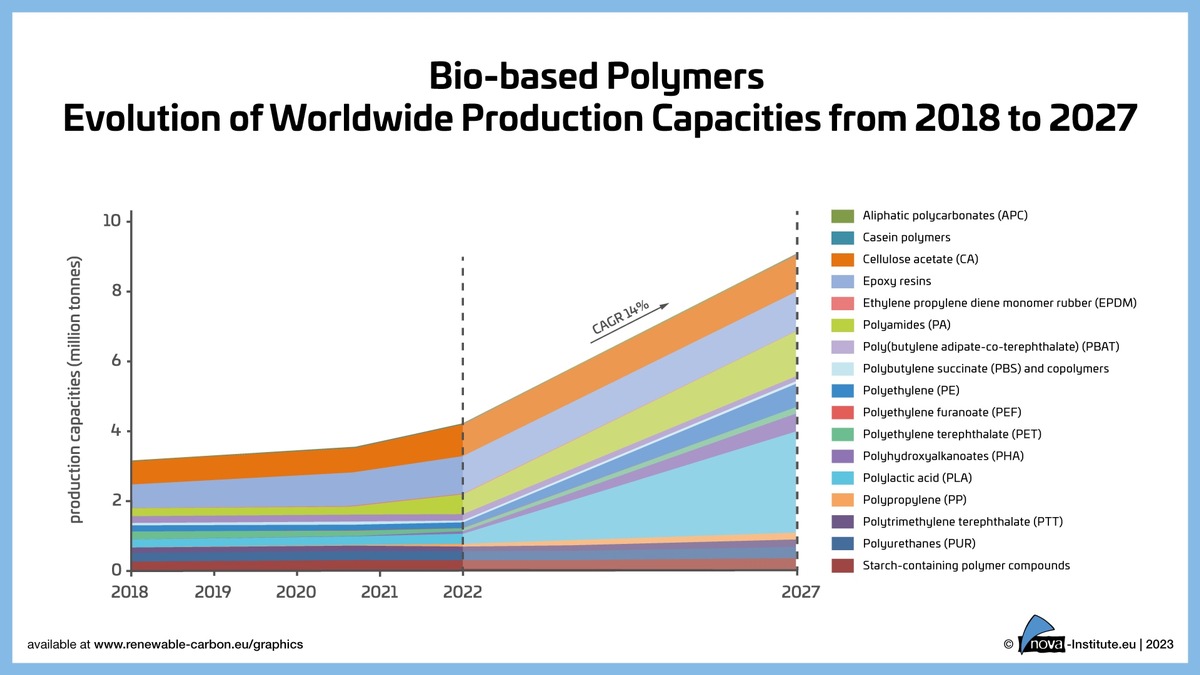
Figure 7 summarises the results of the report and the development of capacities from 2018 to 2027 on the basis of forecasts by current and some new producers. The total installed capacity in 2022 was 4.9 million tonnes with an actual production of 4.5 million tonnes. An increase to 9.3 million tonnes capacity in 2027 is expected, indicating an average compound annual growth rate (CAGR) of about 14%. The following polymers show an even higher increase significantly above the average growth rate: PHA will grow by 45%, PLA by 39%, PA will continue to grow by 37% and PP by 34% until 2027. PE in Europe will increase by 18% until 2027, followed by a 15% increase in casein polymers.
Global production capacities of bio-based polymers by region
After Asia as leading region, which has installed the largest bio-based production capacities worldwide with 41% in 2022, the largest capacities being for PLA and PA, Europe follows with 27%, mainly based on starch-containing polymer compounds, PE and PP. North America shares 19% with major installed capacities for PLA and PTT and South America 13%, mainly based on PE. The less than 1% share of Australia/Oceania is based on starch-containing polymer compounds (Figure 8). With an expected CAGR of 35% between 2022 and 2027, Asia displays the highest growth of bio-based polymer capacities compared to other regions of the world. This increase is mainly due to higher production capacities for PA, PHA and PLA.
Market segments for bio-based polymers
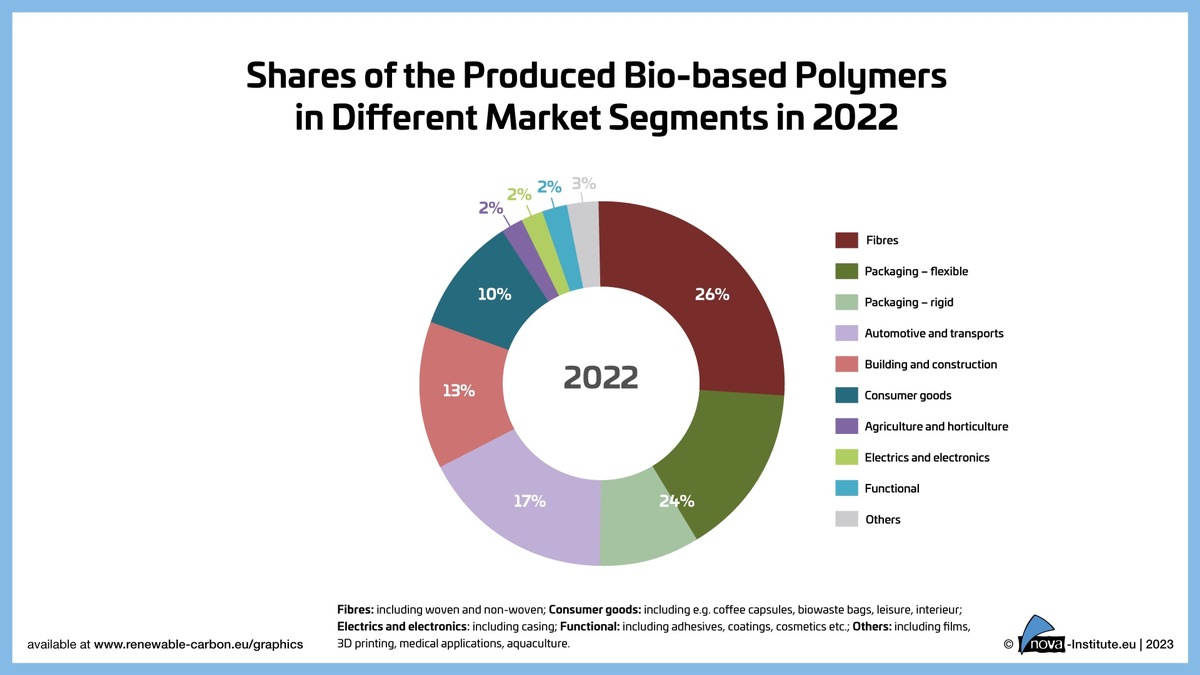
Today, bio-based polymers can be used in almost all market segments and applications, but the various applications per polymer can be very different. Figure 9 shows a summary of the applications for all bio-based polymers covered in the report. In 2022, fibres including woven, non-woven (mainly cellulose acetate (CA) and polytrimethylene terephthalate (PTT)) had the highest share with 26%. Packaging, flexible and rigid, had a 24% share in total, followed by automotive and transport with 17% (mainly epoxy resins, PUR and aliphatic polycarbonates (APCs)), building and construction with 13% (mainly epoxy resins and PA), consumer goods with 10% (mainly starch‑containing polymer compounds, PP and casein polymers). The market segments agri- and horticulture, electrics and electronics as well as functional and others have a market share of under 5%, respectively.
Bio-based non-biodegradable and biodegradable polymers
Bio-based non-biodegradable polymers show a CAGR of 11% until 2027 (Figure 10). Here, the highest growth is expected by polyamides (PA) with 37%, followed by polypropylene (PP) with 34% and polyethylene (PE) with 18%.
Bio-based biodegradable polymers show an even higher growth, with 17%, compared to the overall bio-based polymer growth of 14% until 2027 (Figure 11). This is mainly based on high growth rates of polyhydroxyalkanoates (PHAs) with 45%, polylactic acid (PLA) with 39% and casein polymers with 15%. Biodegradability of polymers is completely independent from the resource the polymer is made of. Thus, being bio-based does not necessarily implement biodegradability of certain polymers. Figure 12 shows biodegradable polymers and their biodegradation in various environments. Polybutylene succinate (PBS) and copolymers such as poly(butylene succinate-co-butylene adipate) (PBSA) are both industrial compostable, but only PBSA biodegrades also under home composting conditions and in soil, according to the conditions defined in the established standards and certification schemes. The same is true for poly(butylene adipate-do-terephthalate) (PBAT), it is industrial compostable and, for certain grades, also home compostable as well as biodegradable in soil. This biodegradability applies for bio-based as well as fossil-based PBS and PBAT. As this report focuses on bio-based polymers, development of fossil-based PBS and PBAT, though being biodegradable, is not detailly shown here. But fossil-based PBS and PBAT production capacities, mainly in Asia, will significantly increase until 2027 with CAGRs of 54% and 40%, respectively.
Responsible for the content under German press law (V. i. S. d. P.):

Dipl.-Phys. Michael Carus (Managing Director)
nova-Institut GmbH, Leyboldstr. 16, DE-50354 Hürth (Germany)
Internet:  www.nova-institute.eu – all services and studies at  www.renewable-carbon.eu
Email:  contact@nova-institut.de
Phone: +49 (0) 22 33-460 14 00
nova-Institute is a private and independent research institute, founded in 1994; nova offers research and consultancy with a focus on the transition of the chemical and material industry to renewable carbon: How to substitute fossil carbon with biomass, direct CO2 utilisation and recycling. We offer our unique understanding to support the transition of your business into a climate neutral future. nova-Institute has more than 40 employees.
Subscribe to our newsletters at  http://www.renewable-carbon.eu/newsletters

To unsubscribe from this press list, please contact  contact@nova-institut.de
Um sich von diesem Presseverteiler abzumelden, kontaktieren Sie bitte contact@nova-institut.de